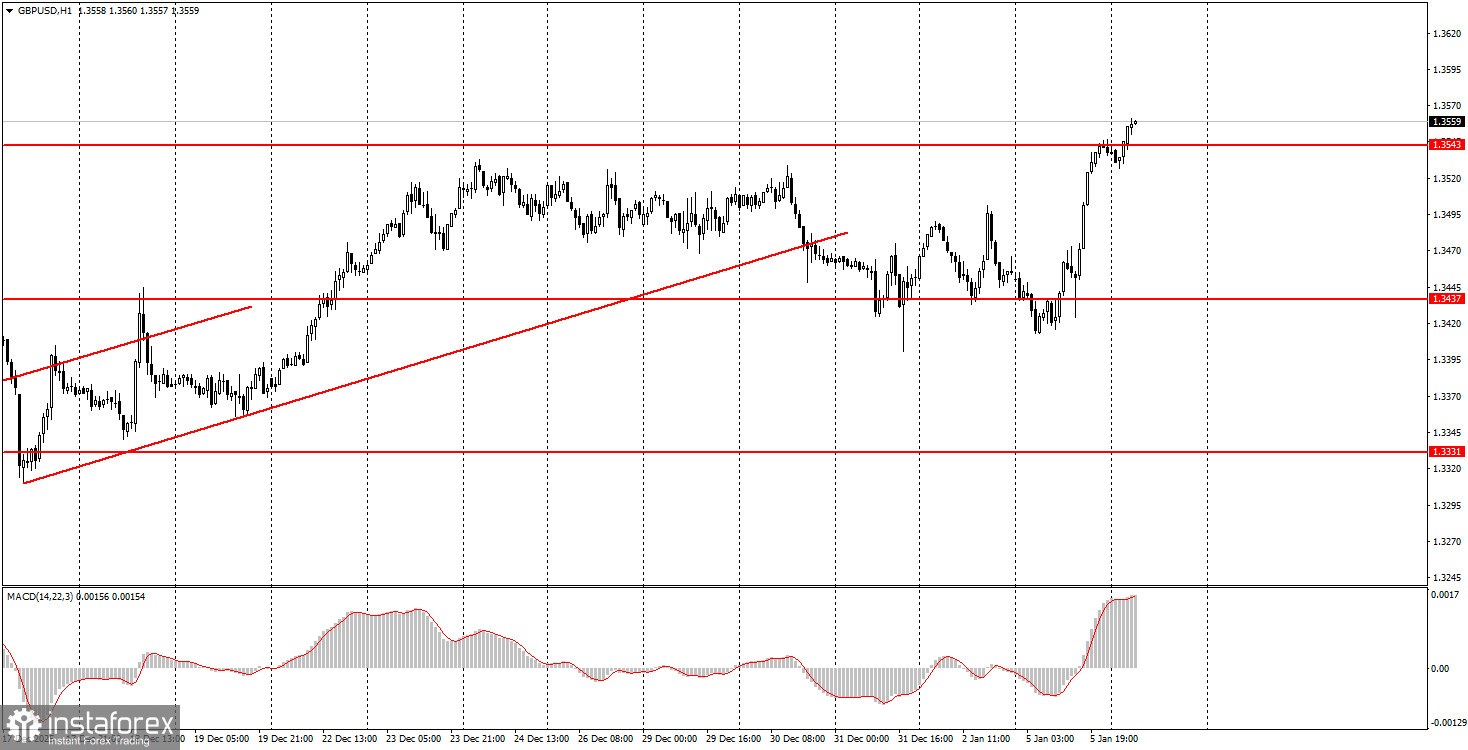
Review of Monday's Trades:GBP/USD 1H Chart
During Monday, the GBP/USD pair gave a clear answer to the question of whether the dollar is a "safe" asset. The answer is "No." While the EUR/USD pair showed at least a small decline, the GBP/USD pair did without such "extras." The rise began in the morning and intensified after the release of the US ISM Manufacturing PMI. The business activity index for December fell to 47.9, although experts had forecast an increase to 48.3 points. Even 48.3 points would still be very low, since any reading below 50 is considered weak. However, such a value could at least have signaled a recovery in the US industrial sector. It did not.
Thus, despite strong growth in the US economy in the third quarter, many continue to expect a significant slowdown. Given the fact that almost all other macroeconomic indicators have failed to impress over the past year, the dollar may continue to decline purely on macroeconomic grounds.
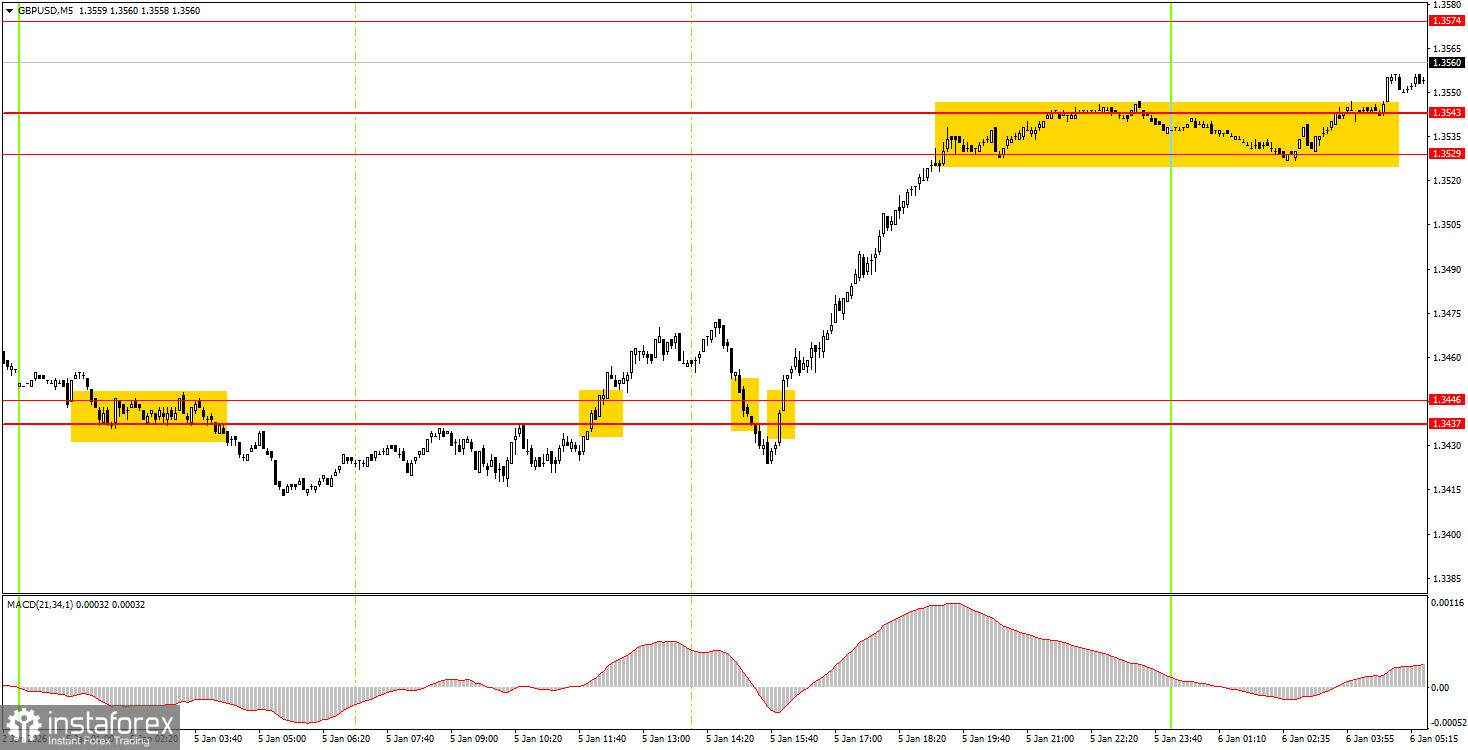
GBP/USD 5M Chart
On the 5-minute timeframe, quite a few signals were formed on Monday, while price movements in the first half of the day were chaotic. It felt as though the market could not decide on a strategy for the day. The first sell signal was formed during the night, but it turned out to be false. The second and third signals near the 1.3437–1.3446 level also proved to be false. A good move began only after the ISM index was released in the US, but this long trade offset the losses from the previous ones.
How to Trade on Tuesday
On the hourly timeframe, the GBP/USD pair has consolidated below the trend line; however, we see no bearish trend at this time. There are no global reasons for medium-term growth in the dollar, so we expect movement only to the upside. Overall, we also expect a resumption of the global uptrend of 2025, which could take the pair to the 1.4000 level within the next couple of months.
On Tuesday, beginner traders may consider new long positions, as the price has consolidated above the 1.3529–1.3543 level, with targets at 1.3574–1.3590 and 1.3643–1.3652. Short positions will become relevant after a consolidation below the 1.3529–1.3543 level, with a target at 1.3437–1.3446.
On the 5-minute timeframe, the following levels can currently be traded: 1.3043, 1.3096–1.3107, 1.3203–1.3212, 1.3259–1.3267, 1.3319–1.3331, 1.3437–1.3446, 1.3529–1.3543, 1.3574–1.3590, 1.3643–1.3652, 1.3682, 1.3763.
On Tuesday, only secondary releases—the second estimates of December business activity indices—are scheduled in the UK and the US. Therefore, market volatility may decrease significantly today.
Basic Rules of the Trading System
- The strength of a signal is determined by the time it took to form (a bounce or a breakout). The less time it takes, the stronger the signal.
- If two or more trades were opened near a level based on false signals, all subsequent signals from that level should be ignored.
- In a flat market, any pair may generate many false signals—or none at all. In any case, at the first signs of a flat, it is better to stop trading.
- Trades are opened during the time period from the start of the European session until the middle of the US session, after which all trades should be closed manually.
- On the hourly timeframe, it is advisable to trade MACD signals only when there is good volatility and a trend confirmed by a trend line or trend channel.
- If two levels are located too close to each other (5 to 20 points apart), they should be treated as a support or resistance zone.
- After the price moves 20 points in the correct direction, the Stop Loss should be moved to breakeven.
What Is Shown on the Chart
- Price support and resistance levels are the levels that serve as targets when opening buy or sell positions. Take Profit levels can be placed near them.
- Red lines are channels or trend lines that show the current trend and indicate the preferred trading direction.
- The MACD indicator (14,22,3)—histogram and signal line—is an auxiliary indicator that can also be used as a source of signals.
Important speeches and reports (always listed in the economic calendar) can have a strong impact on currency pair movements. Therefore, during their release, it is recommended to trade with maximum caution or exit the market to avoid sharp price reversals against the prior move.
Beginner forex traders should remember that not every trade will be profitable. Developing a clear strategy and proper money management are the keys to long-term success in trading.