EUR/USD 5M Analysis
The EUR/USD currency pair, somewhat surprisingly, continued its downward movement on Tuesday. However, if we look at the technical picture, all questions disappear by themselves. The price has been declining for more than a week, and a downward trend line has been formed. Thus, everything is logical—the price is falling within a downtrend. The euro is also located below the Ichimoku indicator lines, which confirms the bearish trend. Recall that at the end of last year, traders once again failed to consolidate above the 1.1800–1.1830 level, which represents the upper boundary of the flat (range) on the daily timeframe, within which the pair has been trading for six months already. Thus, technically everything looks logical here as well—the flat remains in place, and after working off the upper boundary, the price begins falling toward the lower one.
As for the macroeconomic and fundamental background, there were no important publications on Tuesday, except for the inflation report in Germany. The Consumer Price Index slowed to 1.8% in December, which is very bad for the euro. If inflation continues to decline, this means the ECB may resume monetary policy easing. Most likely, the euro's fall on Tuesday was connected precisely with this report.
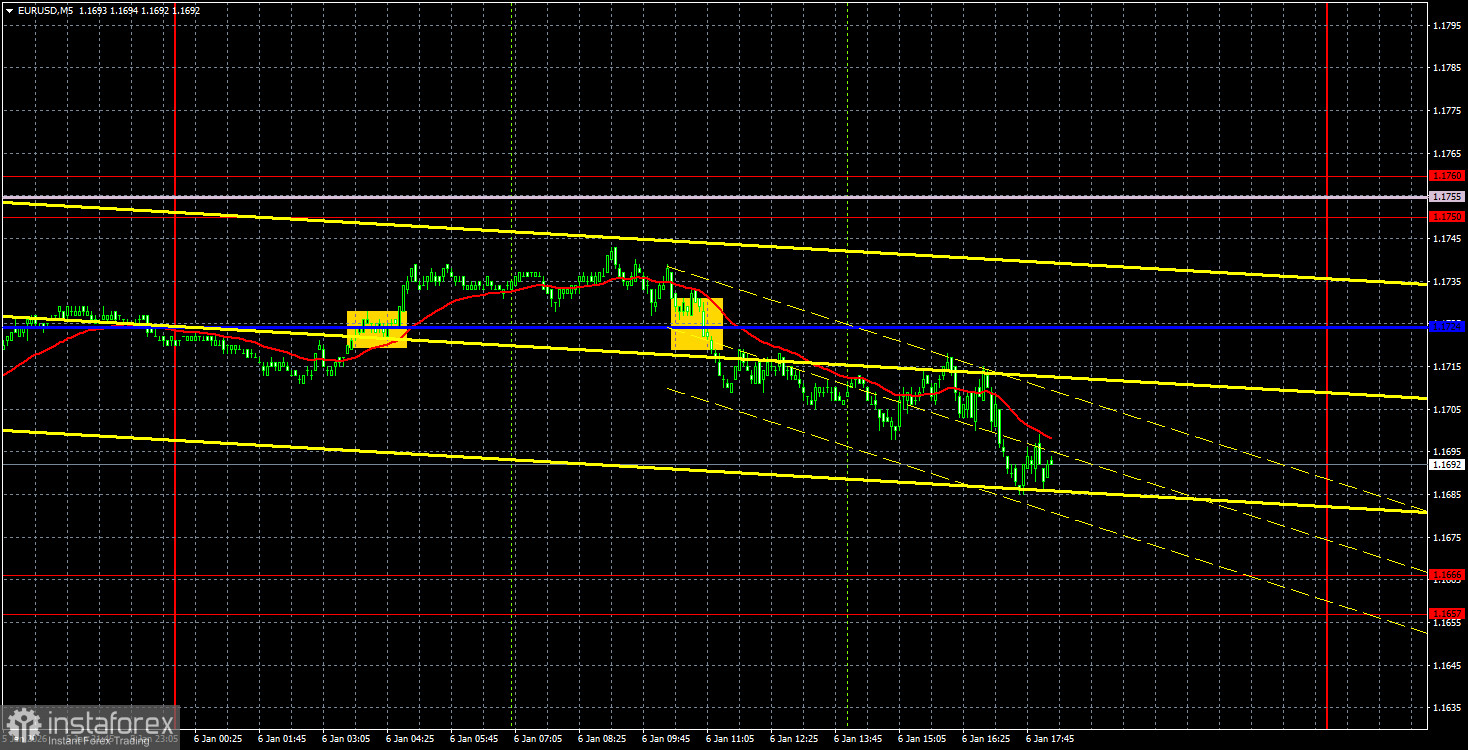
On the 5-minute timeframe, two trading signals were formed yesterday. First, the pair broke above the Kijun-sen line, but opening long positions was hardly advisable, since there is a whole cluster of resistance above in the form of levels 1.1750 and 1.1760, as well as the Senkou Span B line. The second sell signal, also near the Kijun-sen line, could be traded. The downside target is the 1.1657–1.1666 level.
COT Report
The latest COT report is dated December 23. The illustration above clearly shows that the net position of non-commercial traders remained "bullish" for a long time; bears struggled to move into their own dominance zone at the end of 2024 but lost it very quickly. Since Trump took office as President of the United States for the second time, only the dollar has been falling. We cannot say that the decline of the U.S. currency will continue with 100% probability, but current global developments hint precisely at this scenario. The red and blue lines are moving away from each other, which indicates a strong dominance of bulls.
We still do not see any fundamental factors for strengthening the European currency, but there remains a sufficient number of factors for the decline of the American one. The global downtrend still persists, but what does it matter now where the price moved over the past 17 years? Over the last three years, only the European currency has been rising, and that is also a trend.
The position of the red and blue lines of the indicator continues to point to the preservation and strengthening of the bullish trend. During the last reporting week, the number of long positions in the "Non-commercial" group increased by 16.2 thousand, while the number of short positions increased by 1.2 thousand. Accordingly, the net position increased by another 15.0 thousand over the week.
EUR/USD 1H Analysis
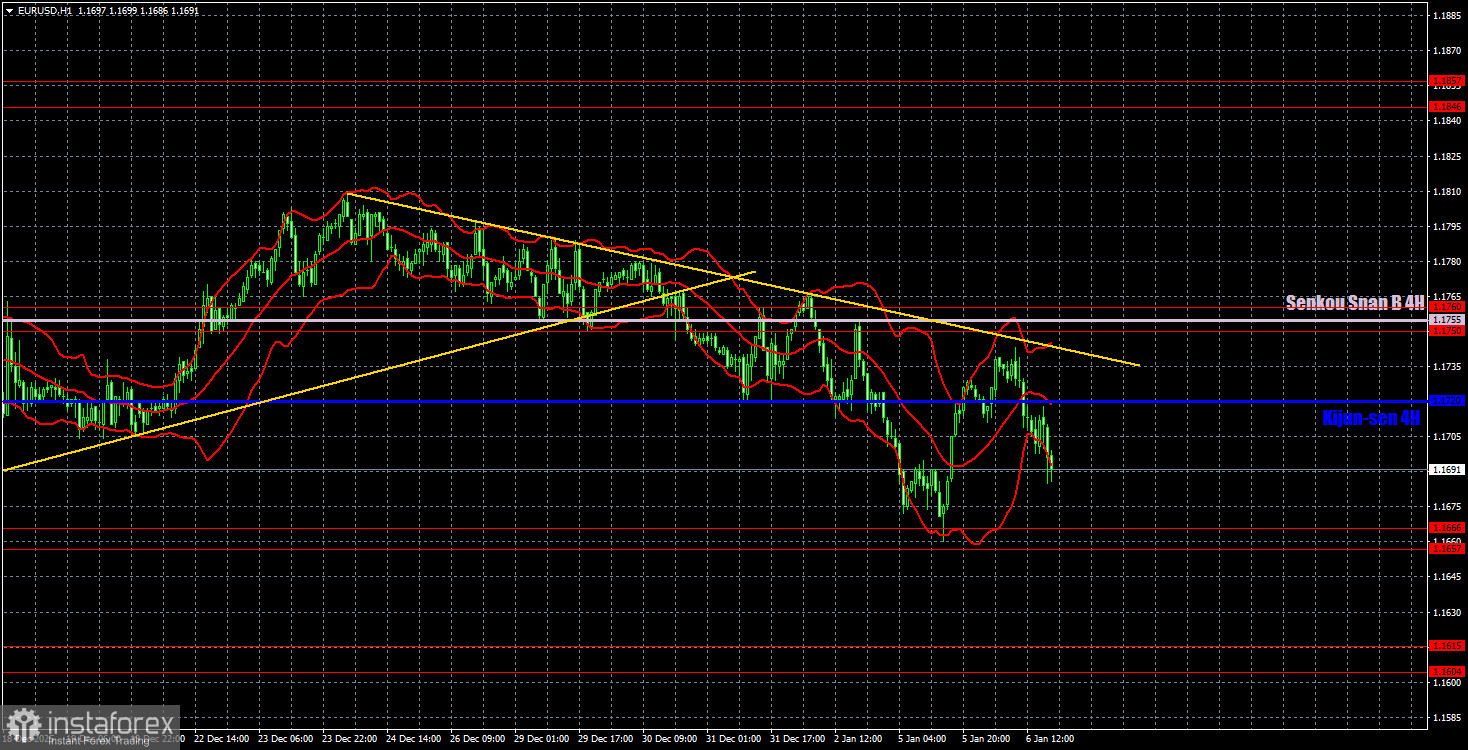
On the hourly timeframe, the EUR/USD pair has changed its trend to bearish. In fact, the upper boundary of the sideways channel 1.1400–1.1830 was worked off twice, and the euro failed to leave this channel. This week, the market will have to "digest" a lot of important information, so movement may be in any direction. We, of course, support a renewed rise in the European currency, and COT reports continue to signal an increase in long euro positions by market makers. But first, traders need to overcome the trend line.
For January 7, we highlight the following trading levels: 1.1234, 1.1274, 1.1362, 1.1426, 1.1542, 1.1604–1.1615, 1.1657–1.1666, 1.1750–1.1760, 1.1846–1.1857, 1.1922, 1.1971–1.1988, as well as the Senkou Span B line (1.1755) and the Kijun-sen line (1.1720). The Ichimoku indicator lines may shift during the day, which should be taken into account when determining trading signals. Do not forget to move the Stop Loss order to breakeven if the price moves 15 points in the correct direction. This will protect against possible losses if the signal turns out to be false.
On Wednesday, the European Union is scheduled to publish an inflation report, which may create new pressure on the euro if inflation declines. In the United States, the ADP, JOLTs, and ISM Services PMI reports will be released, which are also quite important.
Trading Recommendations:
On Wednesday, traders may trade from the Kijun-sen line or the 1.1657–1.1666 level. A consolidation below the 1.1657–1.1666 level will allow opening new short positions with a target of 1.1604–1.1615. A rebound from the 1.1657–1.1666 level will make long positions relevant with targets at the Kijun-sen line and the Senkou Span B line.
Explanations to the Illustrations:
- Support and resistance price levels – thick red lines near which price movement may end. They are not sources of trading signals.
- Kijun-sen and Senkou Span B lines – Ichimoku indicator lines transferred to the hourly timeframe from the 4-hour timeframe. They are strong levels.
- Extreme levels – thin red lines from which the price previously rebounded. They are sources of trading signals.
- Yellow lines – trend lines, trend channels, and any other technical patterns.
- Indicator 1 on the COT charts – the size of the net position of each trader category.