Wednesday Trade Analysis
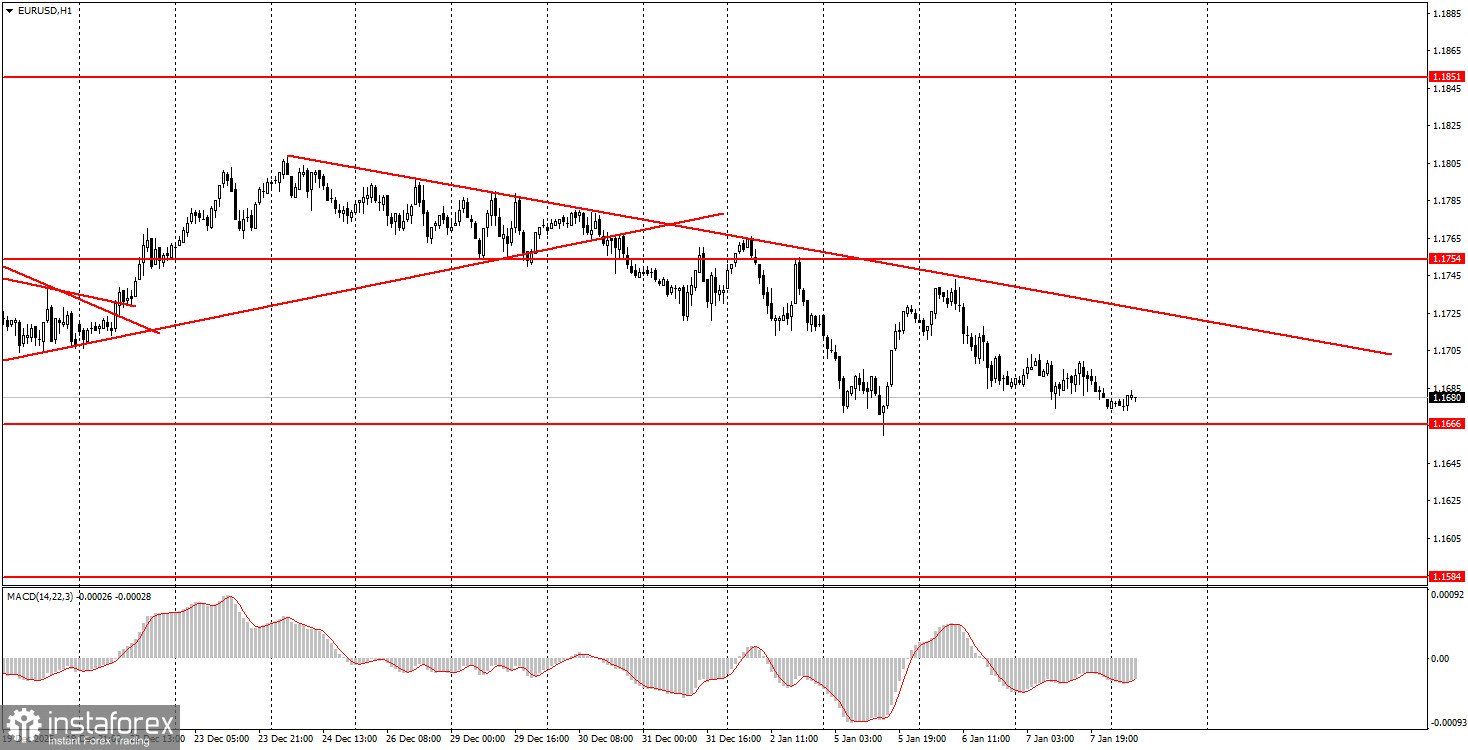
1H chart of the EUR/USD pair
The EUR/USD currency pair traded very quietly on Wednesday. Despite the fact that at least four relatively important reports were released during the day, the market found no reasons for active movement. It all began with the inflation report for the European Union, which showed a neutral reading of 2% year-on-year for December, fully in line with forecasts. In the United States, the ADP, ISM, and JOLTS reports were published. We had said that these reports are interesting, but at the same time the market would focus not on them, but on Nonfarm Payrolls and the unemployment rate. At the same time, there was no reaction to these data at all. Total daily volatility amounted to 29 points.
If the data had been unremarkable, there would have been nothing to question. However, for example, the ISM Services PMI came in at 54.4, which is much higher than forecasts. The ADP and JOLTS reports showed figures below expectations. That is, the dollar did have reasons to move on Wednesday—and quite strong ones. Unfortunately, however, we did not see any interesting price action.
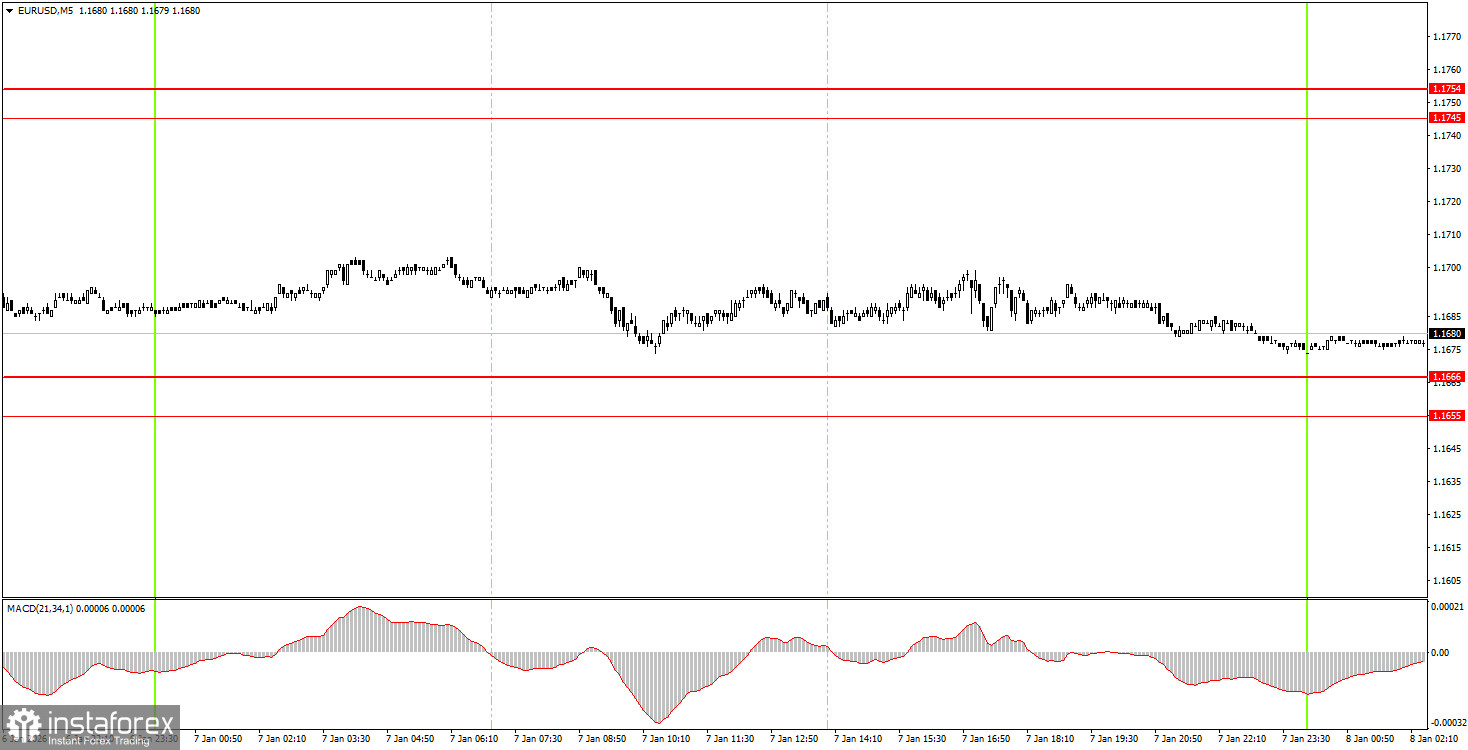
5M chart of the EUR/USD pair
On the 5-minute timeframe, not a single trading signal was formed throughout Wednesday, which is not surprising given volatility of just 29 points. The last sell signal was formed back on Tuesday (a rebound from the 1.1745–1.1754 level), and it brought profit to beginner traders. There were absolutely no grounds for opening trades on Wednesday.
How to Trade on Thursday
On the hourly timeframe, a downward trend continues to form. The price failed to break through the 1.1800–1.1830 level, which is the upper boundary of the daily flat (range), so technically the decline is logical and may continue all the way down to the 1.1400 level. The overall fundamental and macroeconomic background remains very weak for the U.S. dollar; therefore, we expect the pair to resume growth in the medium term.
On Thursday, beginner traders may trade from the 1.1655–1.1666 level. A rebound from this zone would allow opening long positions with a target at 1.1745–1.1754. A firm break below this area would make short positions relevant, with a target at 1.1584–1.1591.
On the 5-minute timeframe, the following levels should be considered: 1.1354–1.1363, 1.1413, 1.1455–1.1474, 1.1527–1.1531, 1.1550, 1.1584–1.1591, 1.1655–1.1666, 1.1745–1.1754, 1.1808, 1.1851, 1.1908, 1.1970–1.1988.
On Thursday, the European Union has scheduled the release of secondary unemployment data and the Producer Price Index. In the United States, initial jobless claims will be published. We do not expect any market reaction to these releases, especially considering that the market ignored much more important reports the day before.
Basic Rules of the Trading System
- The strength of a signal is measured by the time required for the signal to form (a rebound from or a breakout of a level). The less time it takes, the stronger the signal.
- If two or more trades were opened near a certain level based on false signals, all subsequent signals from that level should be ignored.
- In a flat (range-bound) market, any pair may generate many false signals—or none at all. In any case, at the first signs of a flat market, it is better to stop trading.
- Trades should be opened during the time period from the beginning of the European session until the middle of the U.S. session, after which all positions should be closed manually.
- On the hourly timeframe, trades based on MACD signals should preferably be taken only when there is good volatility and a trend confirmed by a trendline or trend channel.
- If two levels are located too close to each other (from 5 to 20 points), they should be treated as a single support or resistance zone.
- After the price moves 15 points in the correct direction, the Stop Loss should be moved to breakeven.
What Is Shown on the Charts
- Price support and resistance levels are levels that serve as targets when opening buy or sell positions. Take Profit levels can be placed near them.
- Red lines represent channels or trendlines that display the current trend and indicate the preferred trading direction.
- The MACD indicator (14,22,3)—histogram and signal line—is an auxiliary indicator that can also be used as a source of trading signals.
Important speeches and reports (always listed in the economic calendar) can strongly affect currency pair movements. Therefore, during their release, trading should be conducted with maximum caution or positions should be closed to avoid sharp price reversals against the prior move.
Beginner forex traders should remember that not every trade can be profitable. Developing a clear strategy and practicing proper money management are the keys to long-term success in trading.