EUR/USD विश्लेषण – 5 मिनट का चार्ट
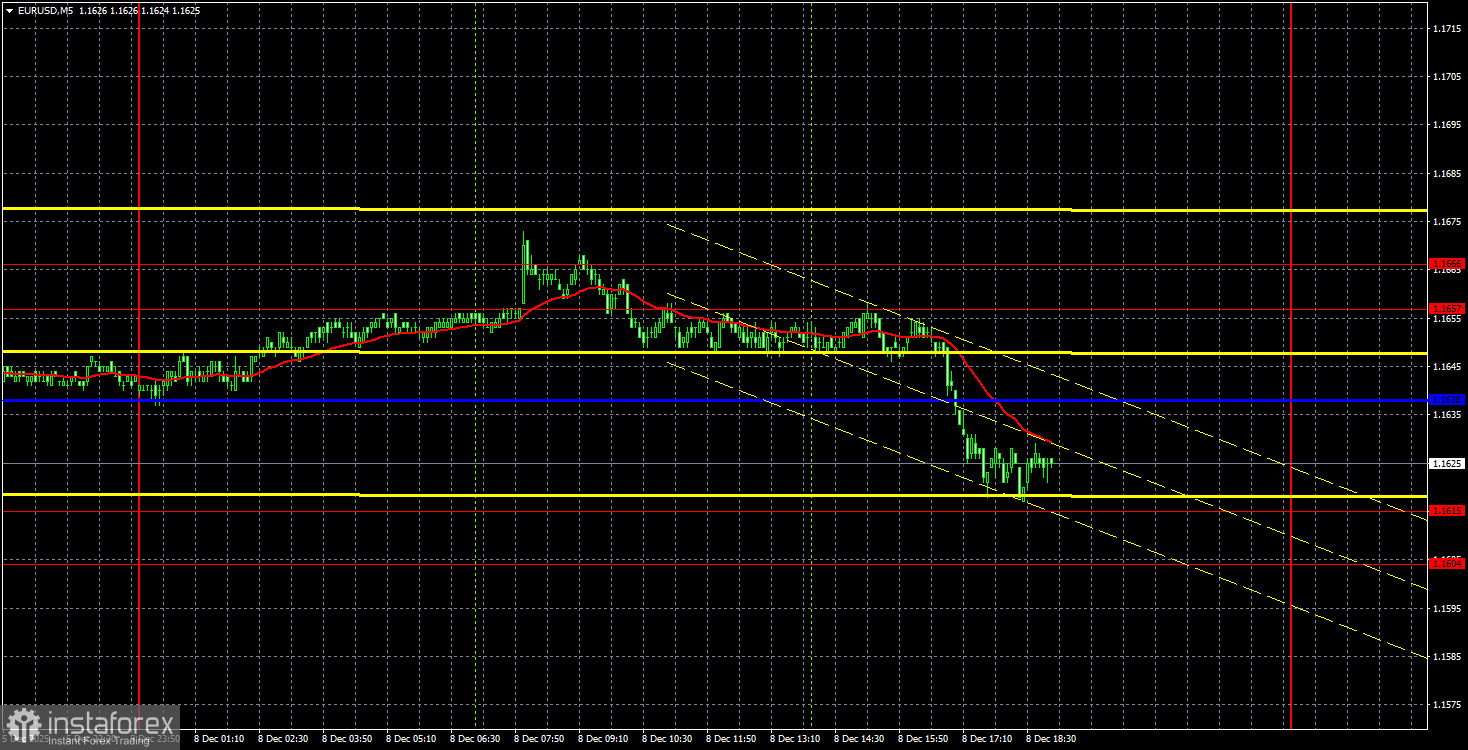
EUR/USD मुद्रा जोड़ी सोमवार को गिर गई। यह एक और उदाहरण है जो दिखाता है कि "बाजार वर्तमान में कितनी तार्किक रूप से ट्रेड कर रहा है।" सोमवार को दिन की एकमात्र मैक्रोइकोनॉमिक रिपोर्ट जर्मनी का औद्योगिक उत्पादन था, जिसने अंततः अपेक्षाओं को पार किया और महीने-दर-महीने 1.8% की ठोस वृद्धि दर्ज की। हालांकि, यूरोपीय या अमेरिकी ट्रेडिंग सत्र के दौरान ट्रेडर्स ने इस रिपोर्ट पर कोई प्रतिक्रिया नहीं दी। इसके बजाय, दोपहर में जोड़ी गिरना शुरू हो गई, जबकि GBP/USD स्थिर रही और और भी कम अस्थिरता के साथ ट्रेड हुई। कुल मिलाकर, गति इस त्रुटिपूर्ण त्रि-आयामी ब्रह्मांड की सीमाओं के बाहर बनी हुई है।
सोमवार को कीमत में गिरावट के परिणामस्वरूप, जोड़ी महत्वपूर्ण Kijun-sen लाइन और ट्रेंड लाइन के नीचे आ गई। इस प्रकार, upward ट्रेंड एक बार फिर बिना वास्तव में शुरू हुए समाप्त हो गया। याद रखें कि बुधवार को फेडरल रिज़र्व की बैठक होगी, जहाँ मुख्य दर में कटौती का निर्णय लगभग निश्चित है। एक बार फिर, डॉलर ने फेड की मौद्रिक नीति में ढील देने पर वृद्धि के साथ प्रतिक्रिया दी। हम जल्दी में यह निष्कर्ष नहीं निकालेंगे कि upward ट्रेंड समाप्त हो गया है, क्योंकि कीमत को अभी भी 1.1604-1.1615 क्षेत्र, Senkou Span B लाइन को पार करना बाकी है। हालांकि, हाल की गति बहुत कमजोर रही है।
सोमवार को 5-मिनट के टाइमफ्रेम पर संकेत बने जिनका वास्तविक ट्रेडिंग मूल्य नहीं था। कीमत 1.1657-1.1666 क्षेत्र से पलटी, लेकिन 20 पिप्स नीचे Kijun-sen लाइन थी। कीमत Kijun-sen के नीचे स्थापित हुई, लेकिन 20 पिप्स नीचे 1.1604-1.1615 क्षेत्र था।
COT रिपोर्ट
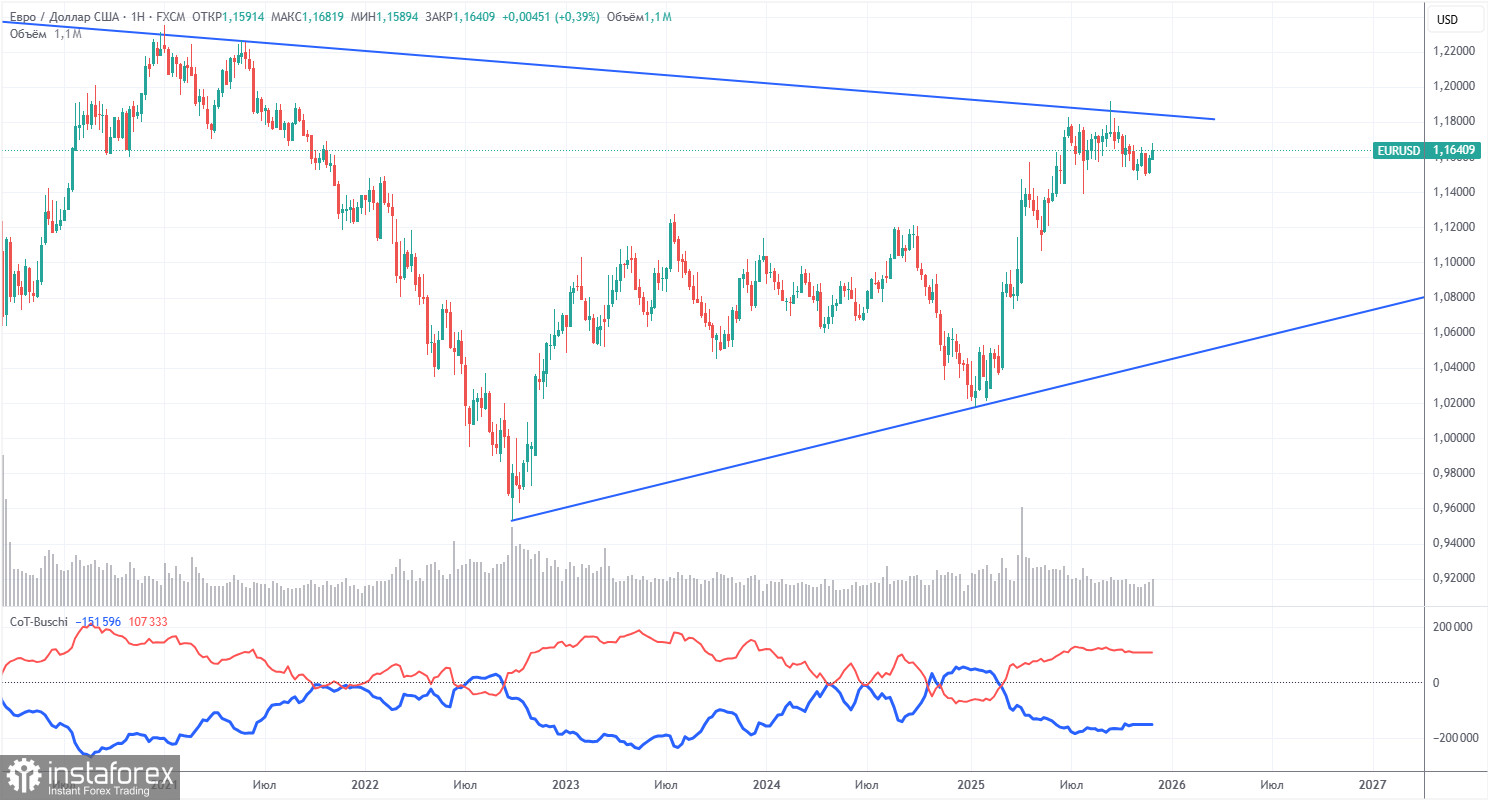
पिछली COT रिपोर्ट पिछले सप्ताह जारी की गई थी और इसकी तारीख 28 अक्टूबर है। दूसरे शब्दों में कहें, तो यह, शाब्दिक रूप से, पुरानी हो चुकी है। ऊपर दी गई छवि दिखाती है कि गैर-व्यावसायिक ट्रेडर्स की शुद्ध स्थिति लंबे समय से "बुलिश" रही है, और भालुओं ने 2024 के अंत में बढ़त बनाने की कोशिश की थी, लेकिन बहुत जल्दी इसे खो दिया। जब से ट्रम्प ने संयुक्त राज्य अमेरिका के राष्ट्रपति के रूप में दूसरी बार पद संभाला, डॉलर लगातार गिर रहा है। हम 100% निश्चितता के साथ यह नहीं कह सकते कि अमेरिकी मुद्रा का पतन जारी रहेगा, लेकिन वर्तमान वैश्विक घटनाक्रम यह संकेत देते हैं कि यह परिदृश्य संभव है।
हम अभी भी किसी भी मौलिक कारक को नहीं देखते हैं जो यूरो के मजबूत होने का समर्थन करता हो, फिर भी डॉलर के गिरने के कई संकेत मौजूद हैं। वैश्विक downward ट्रेंड अभी भी बरकरार है, लेकिन अब मायने रखता है कि कीमत पिछले 17 वर्षों में कहाँ गई है। यदि वैश्विक मौलिक तस्वीर बदलती है, तो डॉलर बढ़ना शुरू कर सकता है, लेकिन वर्तमान में इसके कोई संकेत नहीं हैं।
सूचक के लाल और नीली लाइनों की स्थिति "बुलिश" ट्रेंड को बनाए रखने का संकेत देती है। पिछले रिपोर्टिंग सप्ताह में, "गैर-व्यावसायिक" समूह के लिए लॉन्ग्स की संख्या 5,900 बढ़ी, जबकि शॉर्ट्स 10,300 बढ़े। परिणामस्वरूप, शुद्ध स्थिति सप्ताह के दौरान 4,400 कांट्रैक्ट घट गई। हालांकि, यह डेटा पहले से ही पुराना है और इसका कोई महत्व नहीं है।
EUR/USD विश्लेषण – 1 घंटे का चार्ट
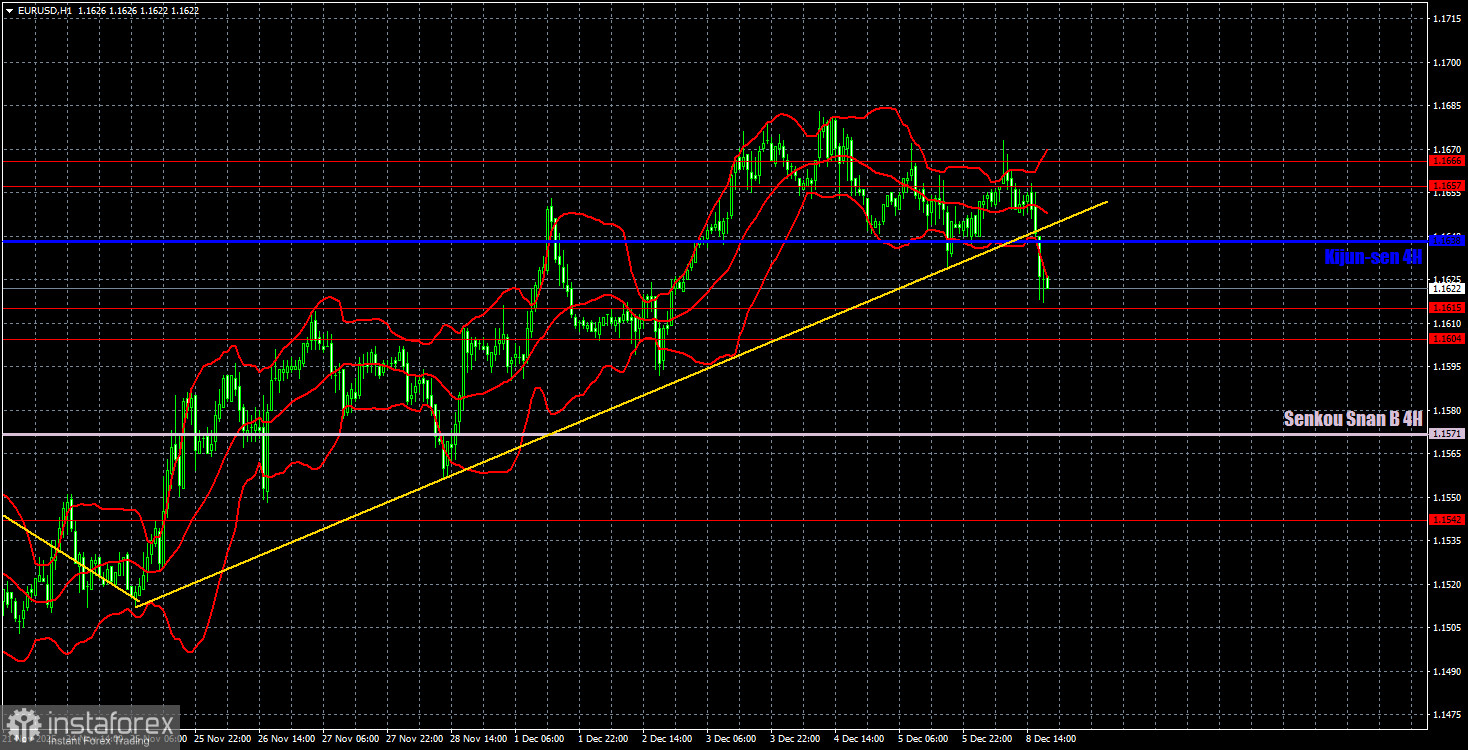
घंटावार टाइमफ्रेम पर, EUR/USD जोड़ी ने संभवतः एक और upward ट्रेंड पूरा कर लिया है, लेकिन हाल के महीनों में जोड़ी की गतिविधियों के स्वरूप को देखते हुए, जब तक यह Senkou Span B लाइन के नीचे स्थापित नहीं होती, हम ऐसा निष्कर्ष नहीं निकालेंगे। कीमत दैनिक टाइमफ्रेम पर 1.1400-1.1830 के साइडवेज चैनल के भीतर बनी हुई है; इसलिए, निकट भविष्य में यूरो के 1.1800 की ओर मजबूत होने की उम्मीद अभी भी की जा सकती है। यूरो का बढ़ना अत्यंत कमजोर है, लेकिन फ्लैट में गतिविधियाँ हमेशा कमजोर और अव्यवस्थित होती हैं।
9 दिसंबर के लिए ट्रेडिंग के लिए हम निम्नलिखित स्तरों को हाइलाइट करते हैं: 1.1234, 1.1274, 1.1362, 1.1426, 1.1542, 1.1604-1.1615, 1.1657-1.1666, 1.1750-1.1760, 1.1846-1.1857, 1.1922, 1.1971-1.1988, साथ ही Senkou Span B लाइन (1.1571) और Kijun-sen लाइन (1.1638)। Ichimoku इंडिकेटर की लाइनें दिन भर में बदल सकती हैं, जिसे ट्रेडिंग सिग्नल तय करते समय ध्यान में रखना चाहिए। यदि कीमत सही दिशा में 15 पिप्स बढ़ती है तो ब्रेक ईवन के लिए Stop Loss ऑर्डर सेट करना याद रखें। इससे संभावित नुकसान से सुरक्षा होगी यदि सिग्नल गलत साबित हो।
मंगलवार को यूरोज़ोन में कोई महत्वपूर्ण घटनाएँ या रिपोर्ट्स निर्धारित नहीं हैं, जबकि संयुक्त राज्य अमेरिका में अपेक्षाकृत महत्वपूर्ण JOLTS और ADP रिपोर्ट्स जारी की जाएंगी। इन रिपोर्ट्स की समस्या यह है कि ADP साप्ताहिक है न कि मासिक, और JOLTS सितंबर और अक्टूबर को कवर करता है।
ट्रेडिंग सिफारिशें:
मंगलवार को, ट्रेडर्स फिर से 1.1604-1.1615 क्षेत्र से ट्रेड कर सकते हैं। हालांकि, इस क्षेत्र के ऊपर Kijun-sen लाइन है और इसके नीचे Senkou Span B लाइन है। हम सिफारिश करते हैं कि तब तक सिग्नल का इंतजार करें जब तक लक्ष्य 20 पिप्स के भीतर न हो।
चित्रण स्पष्टीकरण:
- सपोर्ट और रेसिस्टेंस लेवल: मोटी लाल लाइनें जहाँ कीमत की गति समाप्त हो सकती है। ये ट्रेडिंग सिग्नल के स्रोत नहीं हैं।
- Kijun-sen और Senkou Span B लाइनें: Ichimoku इंडिकेटर की लाइनें जो 4-घंटे के टाइमफ्रेम से घंटावार टाइमफ्रेम पर प्रोजेक्ट की गई हैं। ये मजबूत लाइनें हैं।
- एक्सट्रीम लेवल्स: पतली लाल लाइनें जहाँ कीमत पहले पलटी थी। ये ट्रेडिंग सिग्नल के स्रोत हैं।
- पीली लाइनें: ट्रेंड लाइनें, ट्रेंड चैनल और अन्य तकनीकी पैटर्न।
- COT चार्ट पर इंडिकेटर 1: प्रत्येक ट्रेडर श्रेणी के लिए शुद्ध स्थिति का आकार।