یورو/امریکی ڈالر کا 5 منٹ کا تجزیہ
یورو/امریکی ڈالر کرنسی کا جوڑا منگل کو "اپنے ہوش میں آگیا"۔ یاد کریں کہ پیر کو، جوڑی نے موجودہ معیارات کے لحاظ سے زیادہ اتار چڑھاؤ دکھایا، لیکن منگل نے یہ ظاہر کیا کہ یہ یک طرفہ تھا۔ اور یہ کہنا نہیں ہے کہ منگل کو کوئی اہم واقعات نہیں تھے۔ مثال کے طور پر، ڈونلڈ ٹرمپ نے ایران کے ساتھ تجارت کرنے والے تمام ممالک کے لیے نئے 25% ٹیرف کا اعلان کیا، اور امریکا میں افراط زر کی رپورٹ شائع ہوئی جو کہ فیڈرل ریزرو اور مانیٹری پالیسی کے لیے انتہائی اہم ہے۔ جی ہاں، صارفی قیمت کے اشاریہ نے پیشین گوئیوں سے مماثل ایک "خراب" قدر ظاہر کی۔ لیکن اس قدر سے پتہ چلتا ہے کہ فیڈ جنوری میں کلیدی شرح کو تبدیل نہیں کرے گا۔ اور ڈالر کے لیے، نئی نرمی کا فقدان ایک مثبت خبر ہے۔
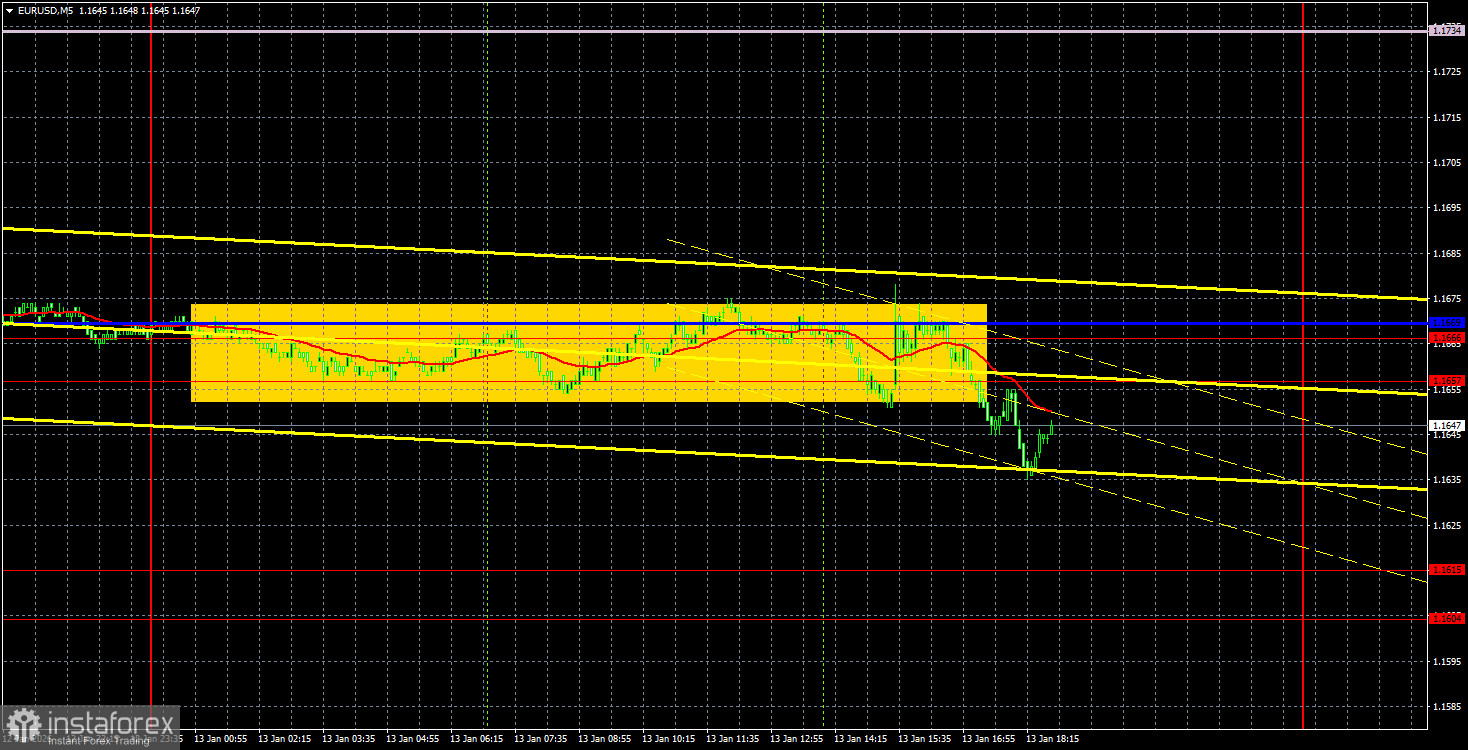
لیکن اس سے کیا فرق پڑتا ہے کہ خبر مثبت ہے یا منفی اگر مارکیٹ 50-پپس یومیہ اتار چڑھاؤ کے ساتھ تجارت کرتی رہے؟ اور یہ بہترین معاملہ ہے۔ کل، مثال کے طور پر، اتار چڑھاؤ کم تھا۔ نیچے کا رجحان برقرار ہے، جیسا کہ نزول کی ٹرینڈ لائن سے ظاہر ہوتا ہے، اور مارکیٹ ایک "آکسیجن" موڈ میں تجارت جاری رکھے ہوئے ہے۔ اور روزانہ TF پر سائیڈ ویز چینل کے اندر۔ لگاتار چھ ماہ۔
زیادہ تر منگل کے لیے 5 منٹ کے TF پر، قیمت 25-پپس رینج میں خصوصی طور پر ایک طرف منتقل ہوئی۔ کل فلیٹ یہاں تک کہ انٹرا ڈے۔ صرف امریکی سیشن کے دوران ہی مارکیٹ "جاگ" اور 1.1657–1.1669 ایریا کے نیچے بند ہوئی، جو کہ، تاہم، ڈالر کے لیے کوئی امکانات نہیں کھولتا۔ اس کے باوجود، تاجر اس سیل سگنل پر کام کر سکتے تھے اور تقریباً 10-15 پِپس حاصل کر سکتے تھے۔
سی او ٹی رپورٹ
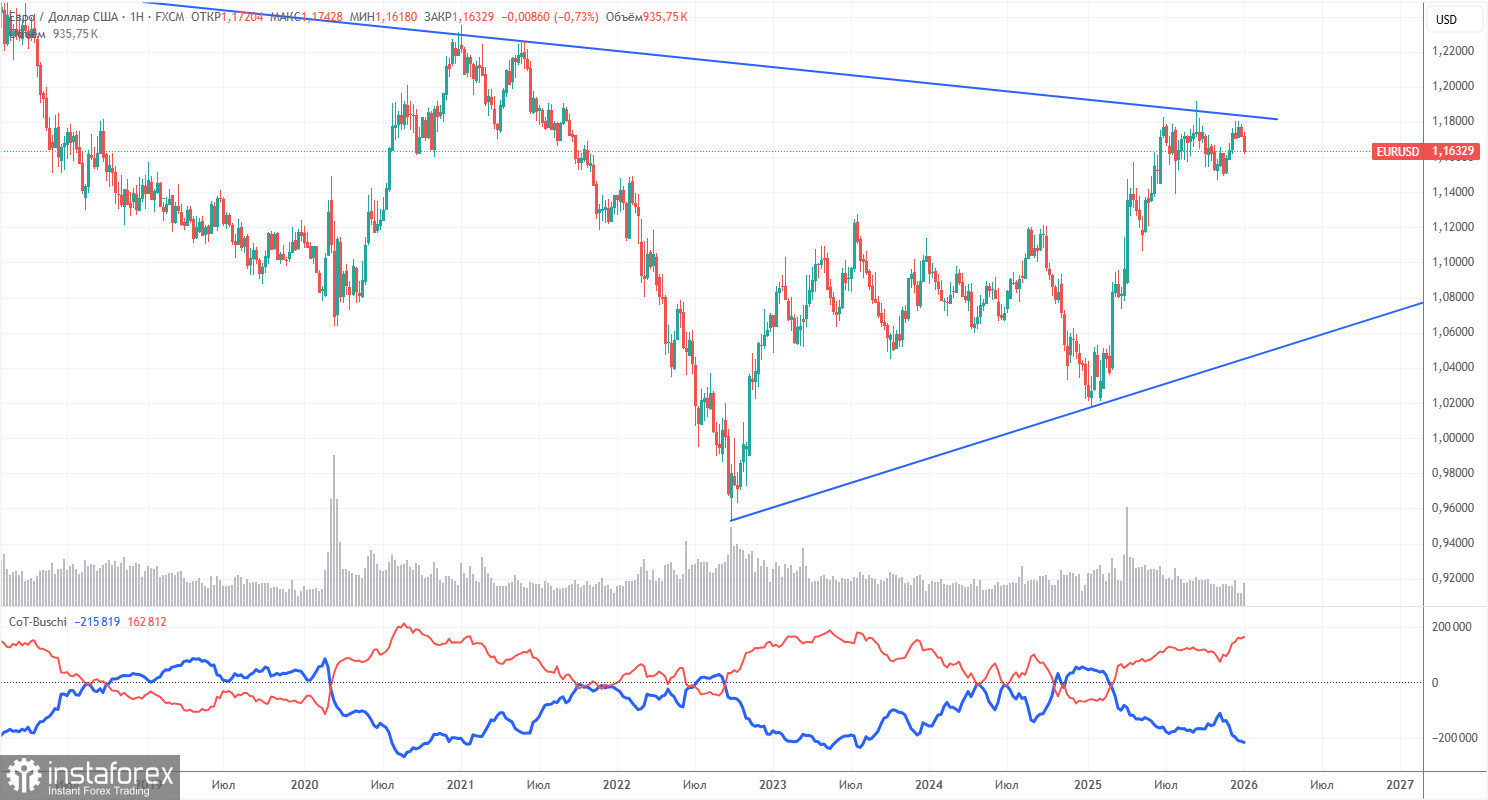
تازہ ترین COT رپورٹ 6 جنوری کی ہے۔ اوپر دی گئی مثال واضح طور پر ظاہر کرتی ہے کہ غیر تجارتی تاجروں کی خالص پوزیشن ایک طویل عرصے سے تیز تھی۔ ریچھوں نے 2024 کے آخر میں بالادستی حاصل کرنے کے لیے جدوجہد کی لیکن جلد ہی اسے کھو دیا۔ جب سے ٹرمپ نے دوسری بار اقتدار سنبھالا ہے، صرف ڈالر ہی گر رہا ہے۔ ہم یہ نہیں کہہ سکتے کہ امریکی کرنسی کی گراوٹ 100% امکان کے ساتھ جاری رہے گی، لیکن موجودہ عالمی واقعات بتاتے ہیں کہ ایسا ہو گا۔ سرخ اور نیلی لکیریں مختلف ہوتی جا رہی ہیں جو کہ مضبوط بیل کے غلبہ کی نشاندہی کرتی ہیں۔
ہمیں اب بھی یورو کی مضبوطی کے لیے کوئی بنیادی عوامل نظر نہیں آتے، جبکہ امریکی کرنسی کی گراوٹ کے لیے کافی عوامل باقی ہیں۔ عالمی کمی کا رجحان اب بھی برقرار ہے، لیکن اس سے کیا فرق پڑتا ہے کہ گزشتہ 17 سالوں میں قیمت کہاں منتقل ہوئی؟ پچھلے تین سالوں میں، صرف یورو ہی بڑھ رہا ہے، اور یہ بھی ایک رجحان ہے۔
سرخ اور نیلے اشارے کی لکیروں کی جگہ کا تعین تیزی کے رجحان کے تحفظ اور مضبوطی کی نشاندہی کرتا ہے۔ گزشتہ رپورٹنگ ہفتے کے دوران، "غیر تجارتی" گروپ میں لانگس کی تعداد میں 3,500 کا اضافہ ہوا، جب کہ شارٹس میں 1,800 کی کمی واقع ہوئی۔ اس کے مطابق، خالص پوزیشن میں ہفتے کے دوران مزید 5,300 معاہدوں کا اضافہ ہوا۔
یورو/امریکی ڈالر کا 1 گھنٹے کا تجزیہ
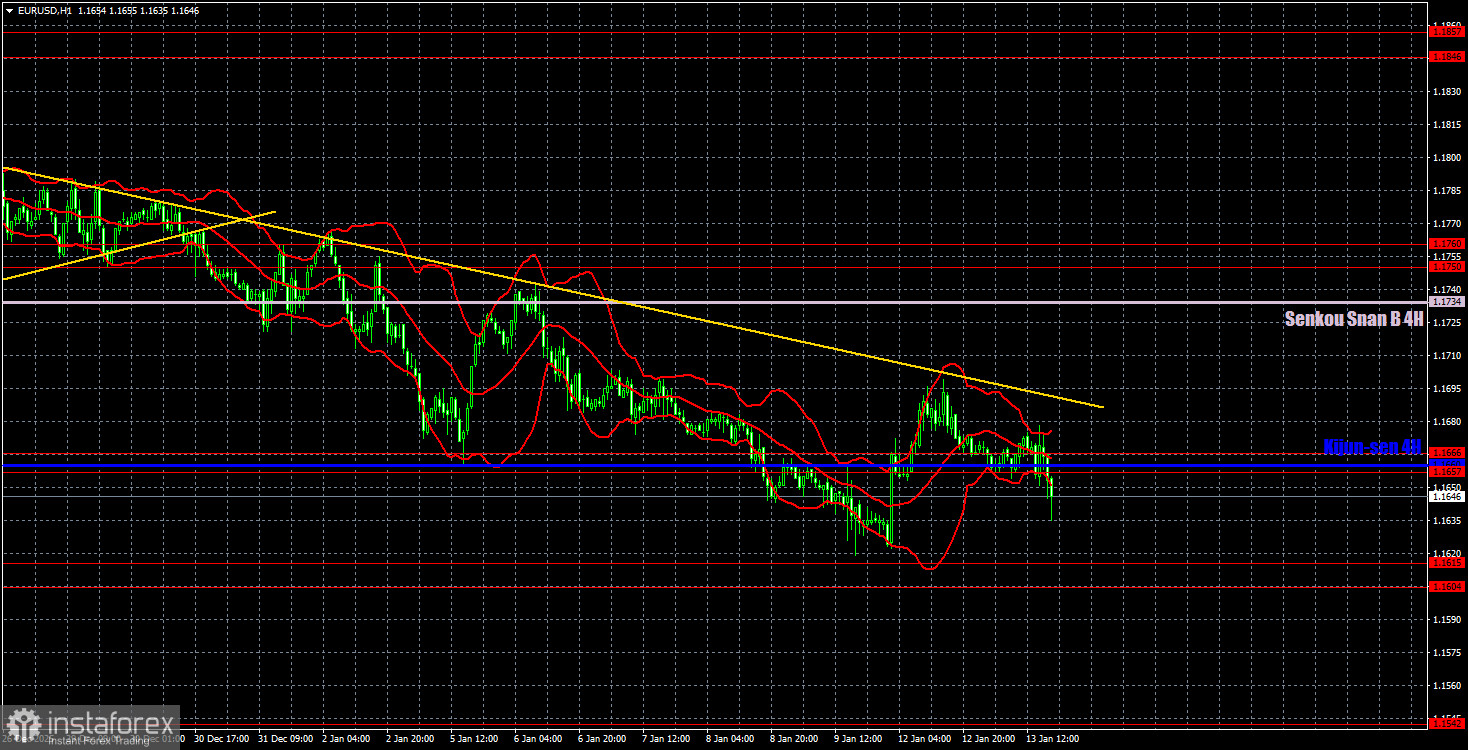
فی گھنٹہ ٹائم فریم پر، یورو/امریکی ڈالر کا جوڑا نیچے کا رجحان بنا رہا ہے۔ کئی ہفتے پہلے، سائیڈ ویز چینل 1.1400–1.1830 کی اوپری لائن کا دو بار تجربہ کیا گیا، لیکن یورو اس سے باہر نکلنے میں ناکام رہا۔ اس طرح، تکنیکی طور پر، جوڑی کا زوال منطقی ہے۔ یورو کی نمو اور 1.1800–1.1830 کے علاقے پر قابو پانے کی نئی کوشش پر اعتماد کرنے کے لیے، کم از کم ٹرینڈ لائن کے اوپر وقفے کا انتظار کرنا چاہیے۔
14 جنوری کے لیے، ہم ٹریڈنگ کے لیے درج ذیل لیولز کو ہائی لائٹ کرتے ہیں: 1.1234, 1.1274, 1.1362, 1.1426, 1.1542, 1.1604–1.1615, 1.1657–1.1666, 1.1760–1.1750,471–1.817. 1.1922، 1.1971–1.1988، اور سینکو اسپین بی (1.1734) اور کیجن سین (1.1660) لائنیں بھی۔ Ichimoku اشارے کی لکیریں دن کے دوران بدل سکتی ہیں، جنہیں ٹریڈنگ سگنلز کا تعین کرتے وقت دھیان میں رکھنا چاہیے۔ اگر قیمت 15 پِپس کو سازگار سمت میں لے جاتی ہے تو سٹاپ لاس کو بریک ایون پر منتقل کرنا نہ بھولیں۔ اگر سگنل غلط ثابت ہوتا ہے تو یہ ممکنہ نقصانات سے بچائے گا۔
بدھ کے روز، EU میں کوئی اہم تقریب طے نہیں ہے، جبکہ کئی کم اہم امریکی رپورٹس جاری کی جائیں گی، جیسے PPI اور خوردہ فروخت۔ لیکن اگر کل سی پی آئی کی رپورٹ پر ردعمل صرف 25 پپس تھا تو کسی کو پی پی آئی سے کیا ردعمل کی توقع کرنی چاہئے؟
تجارتی تجاویز:
بدھ کو، تاجر 1.1657–1.1666 ایریا اور کیجن سین لائن سے تجارت کر سکتے ہیں۔ اس علاقے کے نیچے بند ہونے سے پہلے ہی منگل کو 1.1604–1.1615 کو ہدف بناتے ہوئے مختصر پوزیشنیں کھولنے کی اجازت ہو گی۔ موجودہ اتار چڑھاؤ کے پیش نظر، تجارت کو کئی دنوں تک کھلا رکھا جا سکتا ہے۔ ہم ٹرینڈ لائن کے اوپر وقفے کے بعد ہی لمبی پوزیشنوں پر غور کرنے کی سفارش کریں گے۔
تصاویر کی وضاحت:
قیمت کی حمایت اور مزاحمت کی سطح (مزاحمت/سپورٹ) — موٹی سرخ لکیریں جن کے قریب حرکت ختم ہو سکتی ہے۔ وہ تجارتی سگنل کے ذرائع نہیں ہیں۔
Kijun-sen اور Senkou Span B لائنیں — Ichimoku انڈیکیٹر لائنیں 4 گھنٹے سے گھنٹہ وار ٹائم فریم میں منتقل ہوتی ہیں۔ وہ مضبوط لکیریں ہیں۔
ایکسٹریم لیولز — پتلی سرخ لکیریں جن سے قیمت پہلے باؤنس ہوئی تھی۔ وہ تجارتی سگنل کے ذرائع ہیں۔
پیلی لکیریں — ٹرینڈ لائنز، ٹرینڈ چینلز، اور کوئی اور تکنیکی پیٹرن۔
COT چارٹس پر انڈیکیٹر 1 — ہر تاجر کے زمرے کی خالص پوزیشن کا سائز۔