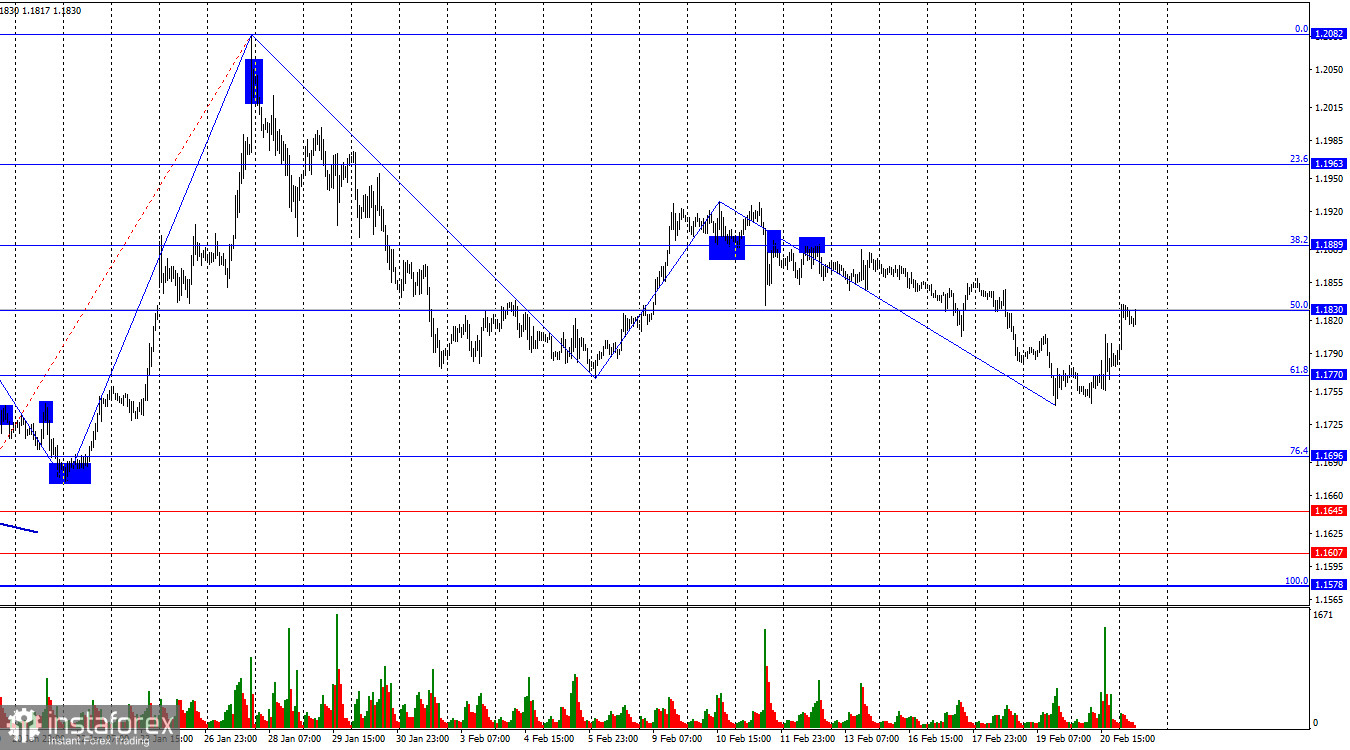
During Friday, the EUR/USD pair reversed in favor of the European currency and rose toward the 50.0% Fibonacci level at 1.1830. A rebound from this level would favor the U.S. dollar and lead to some decline toward the 61.8% corrective level at 1.1770. A consolidation above 1.1830 would support continued growth toward the 38.2% corrective level at 1.1889.
The wave picture on the hourly chart remains simple. The last completed upward wave failed to break the previous peak, while the last downward wave broke the previous low. Thus, the trend remains "bearish." The bulls have taken a pause within what had been a large-scale offensive—one that would have been impossible without Donald Trump—and this pause has dragged on considerably. However, the U.S. president's effective refusal to comply with the Supreme Court's decision could bring the bulls back into the market.
On Friday, the news background supported only bullish traders. Economic data is a separate matter; the most important event occurred Friday evening. The Supreme Court of the United States ruled that all trade levies imposed by Trump in 2025 against certain countries were illegal, as they can only be enacted with approval from the United States Congress. As a result, all non-sectoral tariffs were abolished—but this did not change the overall situation.
Donald Trump immediately introduced new 10% tariffs for all countries worldwide under the Trade Act of 1974. On Saturday, he set the maximum allowable tariff rate at 15%. Thus, for the next 150 days, American consumers and businesses will pay an additional 15% on any imports into the United States. In addition, all sector-specific tariffs (on steel, aluminum, automobiles) remain in force. Therefore, it is difficult to say whether the situation in trade has improved or worsened after the court's decision. One thing is clear: Trump does not intend to abandon his "trade sledgehammer." Traders who had hoped for the end of the trade war quickly exited the market, and the dollar risks entering a new prolonged decline.
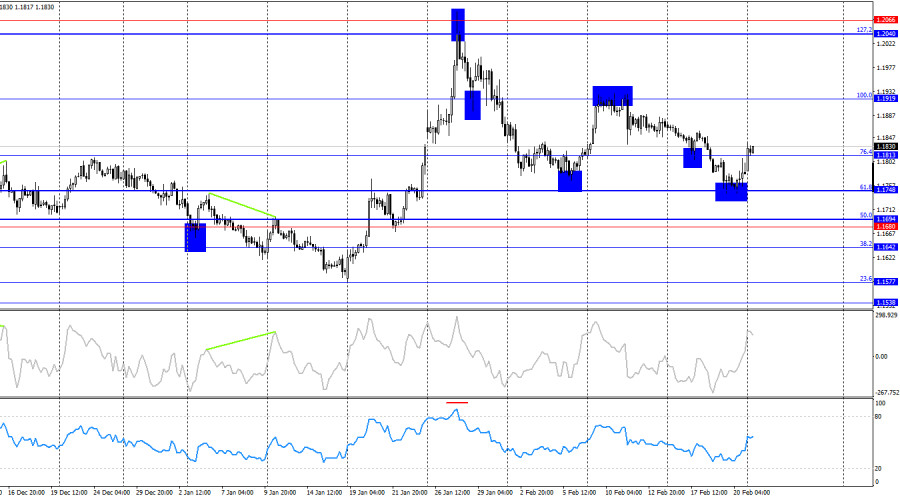
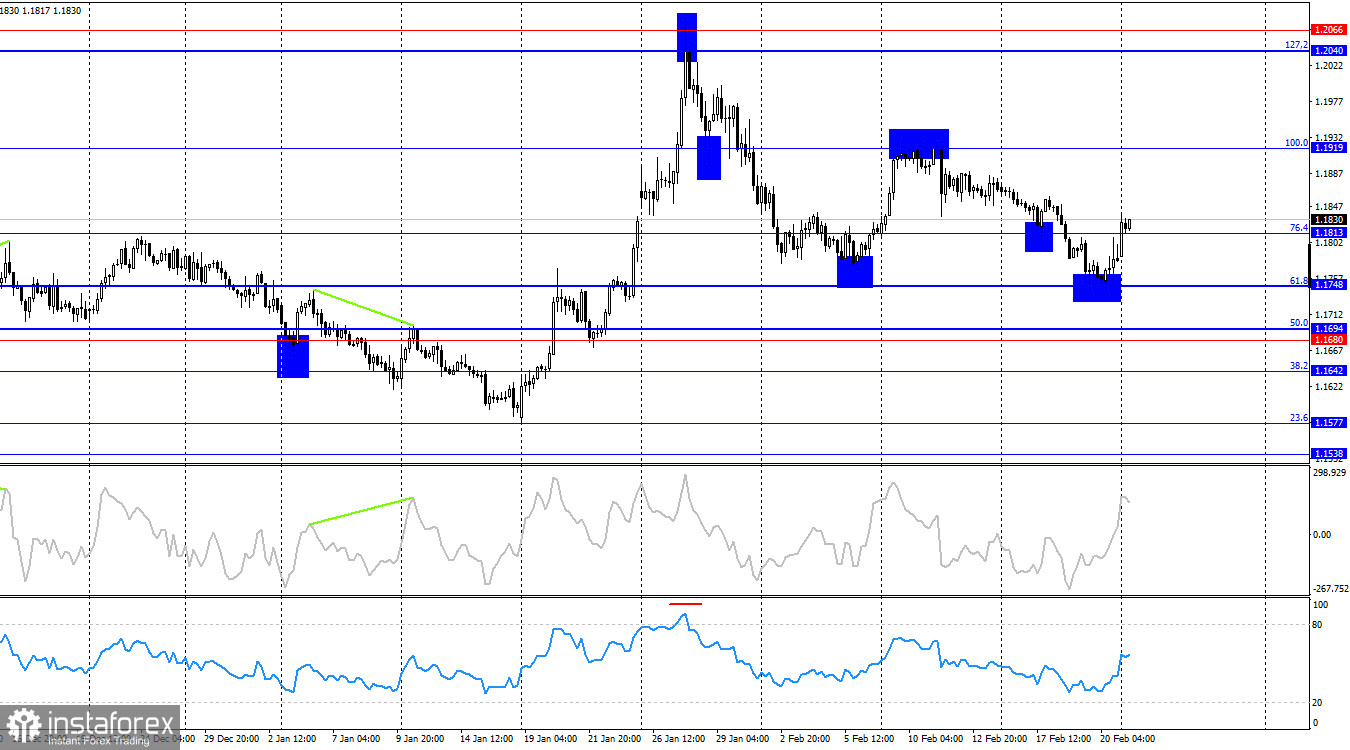
On the 4-hour chart, the pair rebounded from the 61.8% corrective level at 1.1748 and reversed in favor of the euro, consolidating above the 76.4% Fibonacci level at 1.1813. Thus, the growth process may continue toward the next corrective level of 100.0% at 1.1919. A consolidation below 1.1813 would favor the U.S. dollar and a new decline toward 1.1748, but given recent events, it is difficult for me to believe in dollar growth. No emerging divergences are observed today on any indicator.
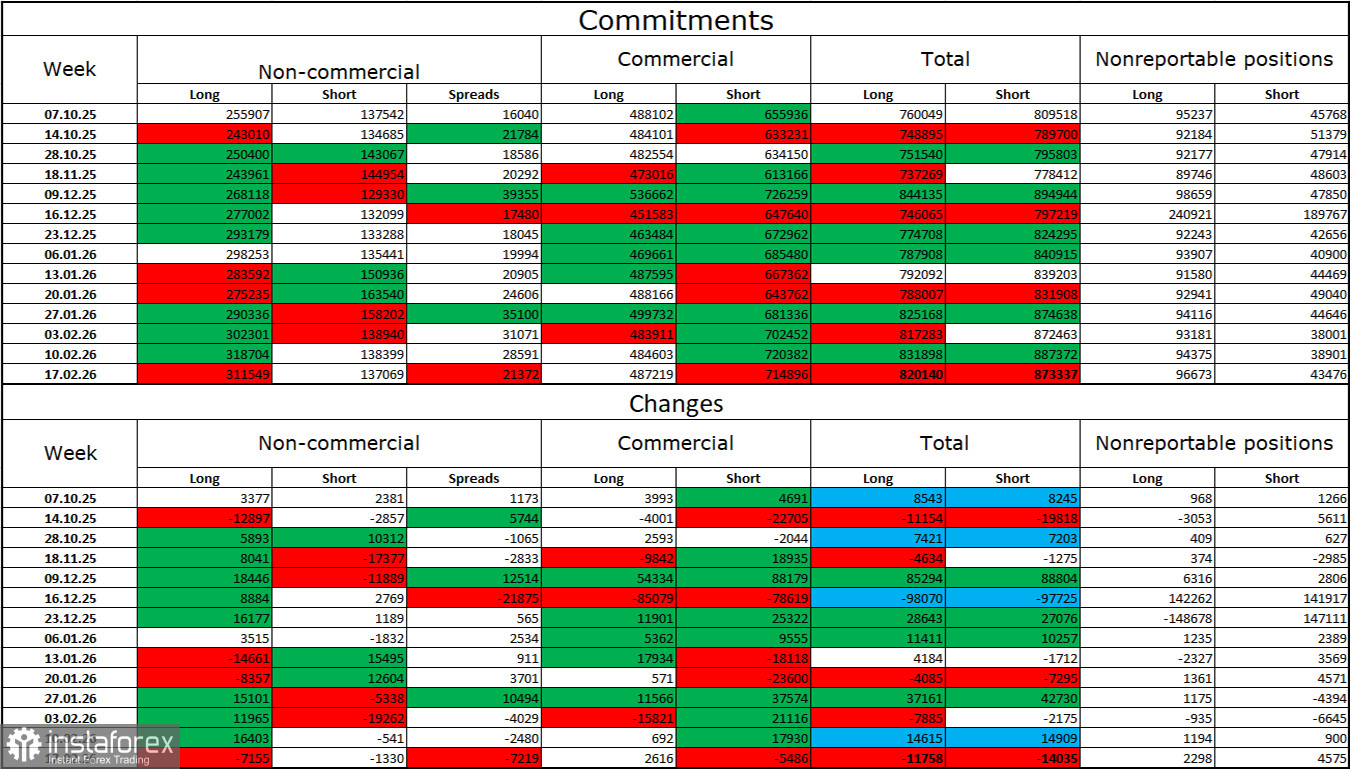
Commitments of Traders (COT) Report
During the latest reporting week, professional traders closed 7,155 long positions and 1,330 short positions. The sentiment of the "Non-commercial" group remains bullish thanks to Donald Trump and his policies and continues to strengthen over time. The total number of long positions held by speculators now stands at 312,000, compared to 137,000 short positions—a more than twofold advantage for the bulls.
For thirty-three consecutive weeks, large players were reducing short positions and increasing long positions. Then a "shutdown" occurred, and now we observe the same pattern again: professional traders continue to build long positions. Donald Trump's policies remain the most significant factor for traders, as they create numerous problems that could have long-term structural consequences for the United States—for example, a serious deterioration of the labor market (2025), a decline in global reputation, and capital outflows from the U.S. Traders also fear a potential loss of independence of the Federal Reserve in 2026, as well as Trump's geopolitical ambitions.
Economic Calendar for the U.S. and the European Union
- European Union – German Business Climate Index (09:00 UTC).
On February 23, the economic calendar contains only one secondary entry. The impact of the news background on market sentiment on Monday may be extremely weak.
EUR/USD Forecast and Trading Tips
- Sell: Possible on the hourly chart upon a rebound from 1.1830, targeting 1.1770 and 1.1696.
- Buy: Were possible upon consolidation above 1.1770 on the hourly chart with a target of 1.1830 (this target has been reached). New buy positions may be considered upon a close above 1.1830 with a target of 1.1889.
Fibonacci grids are drawn from 1.1805–1.1578 on the hourly chart and from 1.1919–1.1471 on the 4-hour chart.